Providing Tools to Investigate Broad, Fundamental Concepts
as well as Complex Phenomena
Broad Concepts
The Motion Visualizer 3D interface is designed to promote a conceptual understanding of motion using a visual approach. It is therefore well suited to the needs of introductory students, particularly students who may have difficulty imagining representing motion. We have developed activities that help students interpret representations in 3D space, and perspective. These activities help students answer questions such as, "what can I learn by looking a the motion from different points-of-view?", or "how do I relate the 3D graph of what I see to graphs of position, velocity, or acceleration versus time?".
Here's how Motion Visualizer 3D helps students interpret motion:
 By rotating the 3D-space graph students get a feel for
the complete motion, and understand how the object moved in each
of the components, x, y, and z. Then, by turning the 3D graph
to a view along the x-, y-, or z-axis, coordinates can be "collapsed
out." This process of vector decomposition is so natural, students
don't even know that that's what they're doing. The process of
analyzing the motion by its change in each dimension becomes very
intuitive.
By rotating the 3D-space graph students get a feel for
the complete motion, and understand how the object moved in each
of the components, x, y, and z. Then, by turning the 3D graph
to a view along the x-, y-, or z-axis, coordinates can be "collapsed
out." This process of vector decomposition is so natural, students
don't even know that that's what they're doing. The process of
analyzing the motion by its change in each dimension becomes very
intuitive.
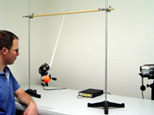
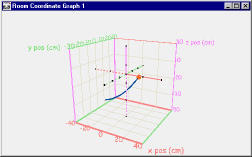
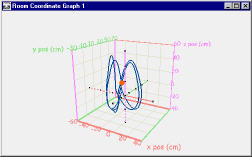
For example, here the motion of a simple pendulum is captured and seen in the 3D graphs:
![]()
Complex Phenomena
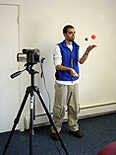
![]() Motion Visualizer 3D is ideal for capturing and
investigating complex motions. Here the complete motion of the
juggler's orange ball is captured on the 3D graph.
Motion Visualizer 3D is ideal for capturing and
investigating complex motions. Here the complete motion of the
juggler's orange ball is captured on the 3D graph.
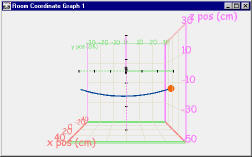
The corresponding
2D graph is the horizontal motion of the ball over time. An interesting
detail, for example, is that in each cycle of the juggling motion
the ball is nearly stationary as indicated by the brief "shelf" to the right of the orange cursor on the 2D graph. This corresponds
to the position of the juggler's hand when he catches
the ball.
![]()
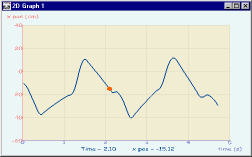
Any number of 2D, time-based graphs can be added to the display and the variables plotted on their axes can easily be changed. A cursor (orange ball) that marks the same point in time between all graphs may be moved to any point to compare the relationship between the variables and examine numeric values. In this way, students build their understanding of the relationships between the kinematics quantities.