|
Freeing Students to Investigate the Motions They Find Interesting
Motion Visualizer 3D is designed to bring reality,
depth, and freedom-to-explore to student investigations and demonstrations.
Motion Visualizer 3D heightens the experience of studying even
the simplest motions, and makes possible the study of large and/or
complex motions that cannot be performed with other systems.
If you can see the
motion, Motion Visualizer 3D can capture it!
Motion Visualizer 3D uses video cameras as sensors
and a brightly colored object or marker as the tracking key. If
the motion of the point of interest can be seen, it can be tracked.
By simply varying the distances from the cameras to the motion,
small or large motions can be tracked. Of course, Motion Visualizer
3D can see faster and in more detail than the eye.
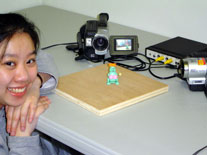
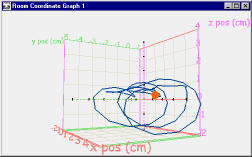
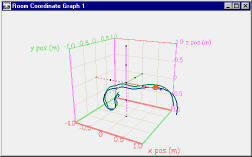
 Small
motions, such as the motion of a jumping toy kangaroo can be seen
in exquisite detail with Motion Visualizer 3D. The 3D graph below
traces the motion of the kangaroo's ears, which were marked with
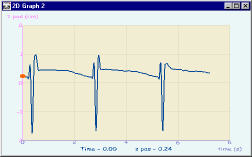
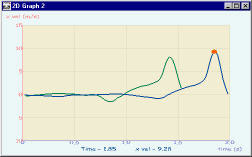
a bright orange sticker as the tracking point. The 2D graph on
the right shows how the kangaroo's height changed over time. Note
how the kangaroo slowly crouches down before each jump. When he
jumps, he springs up higher than his resting height, but as he
swings all the way around, just before landing his ears become
higher than they were on take-off. Small
motions, such as the motion of a jumping toy kangaroo can be seen
in exquisite detail with Motion Visualizer 3D. The 3D graph below
traces the motion of the kangaroo's ears, which were marked with
a bright orange sticker as the tracking point. The 2D graph on
the right shows how the kangaroo's height changed over time. Note
how the kangaroo slowly crouches down before each jump. When he
jumps, he springs up higher than his resting height, but as he
swings all the way around, just before landing his ears become
higher than they were on take-off.
Clearly, Motion Visualizer 3D sees faster and in
far greater detail than the eye. It captures motions beyond the
limits of our perception.
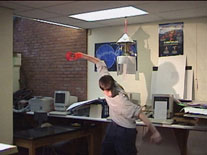
As an example of a larger motion, a student baseball
pitcher recorded his throwing motion. He used a brightly colored
orange glove, now supplied with Motion Visualizer 3D, to track
his pitching hand from the initial windup through his follow-through.
The 3D graph, with two throws recorded, shows how consistent the
pitcher is. The two pitches, however, are not identical. The
2D graph of the horizontal velocity (x-coordinate) shows that
the pitcher's hand was moving somewhat faster in the blue trial.
|